Help
- 右上角的时钟图标会对每道题和所有题计时
- 右上角的文件夹点击可以打开和关闭当前题号
- 点击右上角的星星图标 ,所有被收藏的题目均可在“我的”-“收藏”中找到
- 点击右下角 Next进入下一题。注意:如果你没有做当前题目,你将不可以进入下一题
- 点击左下角的 Quit或 End Exam 即可退出练习
End Section Review
-
你想结束这部分的检查吗?
如果你点击Yes,你将结束该部分模考。
yes
no
End Exam
 You are about to end your exam
If you click the Yes button below,your exam will end.
Are you sure you want to end your exam?
yes
no
Answer Edit Confirmation
-
你想更改这个问题的答案吗?
Yes,换答案
No,保留原始答案并回到问题上


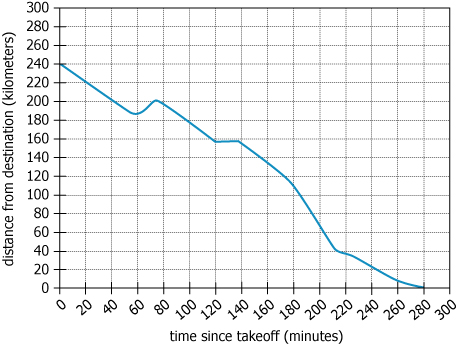 Facts: The graph refers to a plane's flight from one location to another. The vertical axis represents the distance, in kilometers, between the plane and its destination. The horizontal axis represents the time, t minutes, since takeoff.Make the appropriate selection from each drop-down menu to complete each sentence so that it is consistent with the information presented in the graph.The plane was closer to its destination at .Of all of the 20-minute intervals beginning and ending at times labeled on the graph, the interval in which the plane traveled farthest toward its destination was the interval from .
 做题笔记
做题笔记
 暂无做题笔记
 提交我的解析
