Help
- 右上角的时钟图标会对每道题和所有题计时
- 右上角的文件夹点击可以打开和关闭当前题号
- 点击右上角的星星图标 ,所有被收藏的题目均可在“我的”-“收藏”中找到
- 点击右下角 Next进入下一题。注意:如果你没有做当前题目,你将不可以进入下一题
- 点击左下角的 Quit或 End Exam 即可退出练习
End Section Review
-
你想结束这部分的检查吗?
如果你点击Yes,你将结束该部分模考。
yes
no
End Exam
 You are about to end your exam
If you click the Yes button below,your exam will end.
Are you sure you want to end your exam?
yes
no
Answer Edit Confirmation
-
你想更改这个问题的答案吗?
Yes,换答案
No,保留原始答案并回到问题上


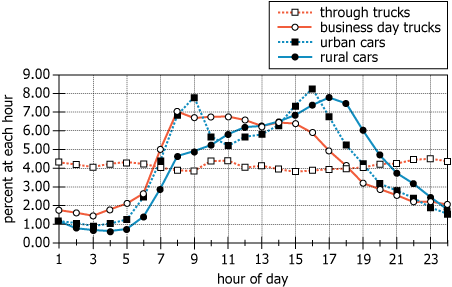 The traffic that passes through a certain location is composed exclusively of the following nonoverlapping types of vehicles: “rural cars,” “urban cars,” “business day trucks,” and “through trucks.” For each of these vehicle types, and for each hour of the day, the graph depicts the typical percentage of the total number of the given type of vehicle passing through the location during that hour. For example, the graph indicates that slightly less than 8 percent of all urban cars that pass through the location on a typical day do so during hour 9.On the basis of the given information, select from each of the drop-down menus the option that makes the statement most accurate.From hour 17 to hour 22, the percent change in number of business day trucks passing through the location .Assuming that total traffic over the day is the same for each of the four vehicle types, the hour of maximum total traffic is .
 做题笔记
做题笔记
 暂无做题笔记
 提交我的解析
