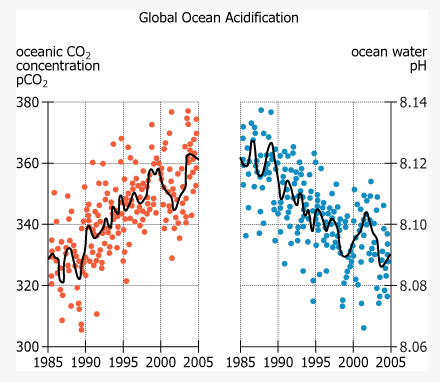
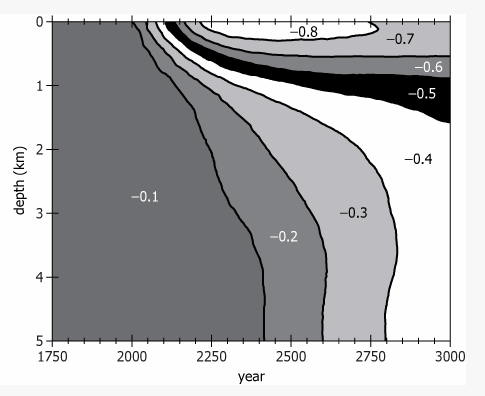
Increasing concentrations of carbon dioxide (CO2) in the atmosphere are making the oceans more acidic—in other words, lowering the pH of ocean water. Worldwide, the average pH of the upper ocean—the top 1,000 m—has declined 0.12, to 8.1, between 1750 and 2010. If humans continue to emit greenhouse gases at current rates, atmospheric CO2 concentrations will reach 500 parts per million (ppm) by 2050 and 800 ppm by 2100, by which time the pH of the upper ocean could drop to 7.8 or 7.7. The deep ocean—below 4,000 m—had a pH of 8.2 in 2010. At that depth, acidity is relatively stable and not expected to increase as quickly, as is shown in the graph labeled Long-Term Graph.The base of the ocean food web is phytoplankton, which, like plants, use sunlight for photosynthesis and thus can live only in the upper ocean. For many types of phytoplankton, acidification makes it harder to absorb iron, a vital nutrient. Research suggests that a 0.3 decline in pH reduces phytoplankton iron consumption by about 15 percent, slowing photosynthesis and impacting growth and reproduction. Comparable changes in the past correlated with massive extinctions of sea life.
This scatter plot shows oceanic CO2 concentrations reported in partial pressure (pCO2) and water acidity reported in pH, from 1985 to 2005. Each dot represents a specific measurement in the upper ocean. The curves are statistical-based models representing statistical trends derived from the measurements.

In the graph, ΔpH refers to change or predicted change in pH of ocean water since the pre-1750 period, expressed in relation to water depth and year.

 mofa留学圈


 做题笔记
做题笔记
 暂无做题笔记
 提交我的解析


